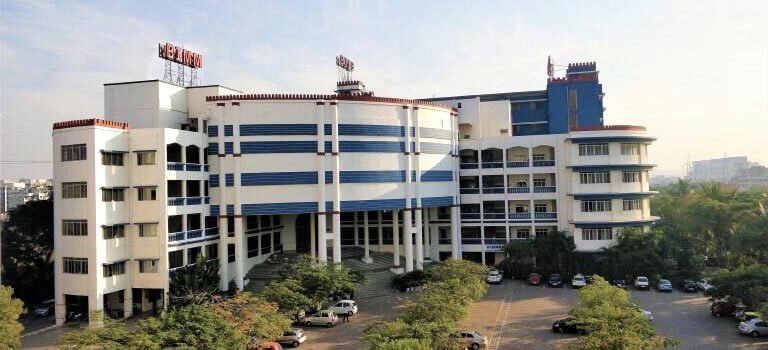
Sri Balaji University Pune
SBU was established in 1999, it spreads across 16.5 acres with a base of 15,000+ alumni. It runs MBA program across 4 different colleges – BIMM, BIMHRD, BIIB and BITM.
The Sri Balaji University League
- Balaji Institute of Modern Management, BIMM
- Balaji Institute of Management and Human Resource Development, BIMHRD
- Balaji Institute of International Business, BIIB
- Balaji Institute of Telecom & Management, BITM
| Institute | Specializations |
| BIMM |
MBA– Marketing Management – Finance – PM & HRD – Data Science & Business Analytics – Digital Marketing & Business Analytics – Telecom & Business Analytics – Product Management & Business Analytics – Operations & Supply Chain Management |
| BITM |
MBA– Marketing Management – Finance – Operations & Supply Chain Management MBA-Technology Management– Data Science & Business Analytics – Digital Marketing & Business Analytics – Product Management & Business Analytics – Telecom & Business Analytics) |
| BIIB |
MBA-International Business– Marketing and International Business Management MBA-Marketing Management– Sales and Marketing Management MBA Finance– Finance and Financial Services |
| BIMHRD |
MBA– Marketing Management – Finance – PM & HRD – Data Science & Business Analytics – Digital Marketing & Business Analytics – Telecom & Business Analytics – Product Management & Business Analytics – Operations & Supply Chain Management |
Sri Balaji University Admission Process
- Graduation from UGC recognized university with a minimum of 50% marks (45% for SC/ST).
- Students currently in the final year of their graduation can also apply
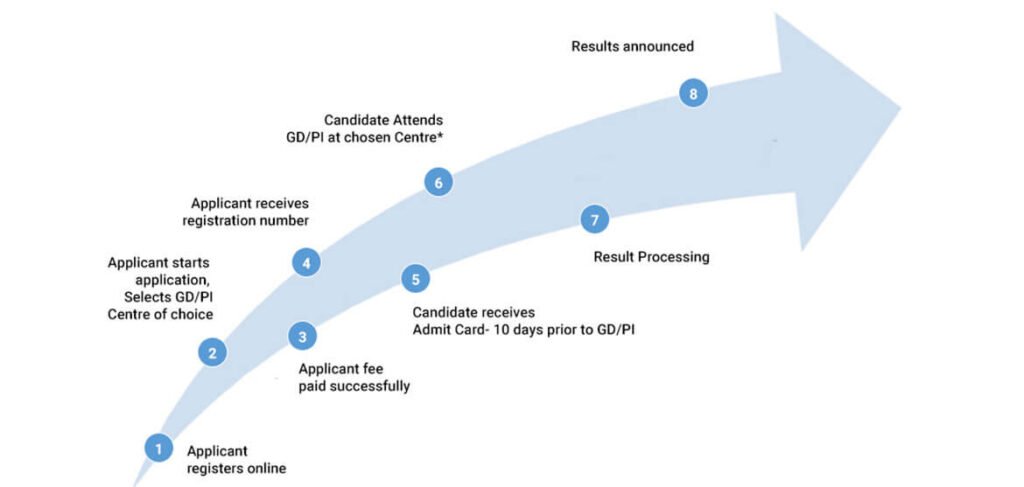
Sri Balaji University Selection Process
- A student can apply on the basis of CAT, XAT, MAT, CMAT, MBA CET, SBEST
- Group discussion which might extend to role play, case studies and extempore speech
- Personal Interview to assess the suitability of the candidate for a particular specialization
The last date to apply is 30th April 2023
The cut-off for Sri Balaji University is in the range of 70%ile to 80%ile.
Sri Balaji University Fee
The total fee for 2-year course is is Rs. 10.7 lakh
*The hostel accommodation and mess charges are Rs. 67,000+ per year
Sri Balaji University Placements
Students of batch 2021-2023 are placed at top-notch companies
Average Salary: Rs. 8.25 LPA
Highest Salary Rs. 20.58 LPA
Note: The placements statistics for all the 4 institutes is not available. The students aspiring to get into SBU are advised to have a word with current students about the placement figures and overall curriculum. The overall intake is about 1000 students so Median salary number should be take into consideration.
Must Explore